My research focuses on internal climate variability, which is the natural part of long term climate change. In particular, I look at low-frequency (20 year cycles or longer) variability in the Northern Hemisphere.
Internal climate variability is generally isolated to a particular region or basin, like the North Pacific ocean. Within each basin, variability is further divided into individual modes of variability. These modes can have a wide range of features, such as different time scales that they operate on or how they are created. Some have clear dynamical sources, like El Niño (ENSO) in the Tropical Pacific ocean. Others, like the Pacific Decadal Oscillation (PDO) in the North Pacific ocean, are generated by multiple sources that affect the same region.
For most climate modes, the sources of their variability are not well known. My work is aimed at improving our understanding of why internal climate variability exists. This understanding can ultimately help to better predict future changes to our climate system, which helps prevent loss of life and property.
This work utilizes different types of observations, climate model outputs, and statistical analyses. I do a lot of programming (mostly Python) to manage all of this data. The climate model data in particular is exceptionally large. We use large ensembles, where the same climate model is slightly modified a certain number of times (20 to 100, usually). This tool enables us to average out the randomness of the climate system, leaving behind only what matches in every single run.
Statistics interests me greatly, especially the many misconceptions (many of which I make myself) that surround the topic. Data is our main method of scientific documentation, and statistics is how we make sense of all that data. Using proper statistical tools is hugely important to making correct conclusions. A number of studies have focused solely on improper statistics use in science (link below). I try to emphasize careful consideration of statistics in my work; what information does this particular analysis tell me? what does "statistically significant" mean? are the tests used appropriate for my data and questions?
Beyond my research, I enjoy applying statistics to other things, namely ice hockey data. I use the National Hockey League's API to get all sorts of game data, and use this to evaluate player and team performances. Here, predictions are equally difficult, but not quite as influential as climate predictions. The parallels between hockey and climate (amongst other things) fascinate me. I love to discuss all of these ideas and topics, so please contact me if you would like to!
Beyond my research, I enjoy applying statistics to other things, namely ice hockey data. I use the National Hockey League's API to get all sorts of game data, and use this to evaluate player and team performances. Here, predictions are equally difficult, but not quite as influential as climate predictions. The parallels between hockey and climate (amongst other things) fascinate me. I love to discuss all of these ideas and topics, so please contact me if you would like to!
My first paper, "No Internal Connections Detected Between Low Frequency Climate Modes in North Atlantic and North Pacific Basins", is published! Check it out here: https://agupubs.onlinelibrary.wiley.com/doi/full/10.1029/2022GL097957
A PDF is also available below.
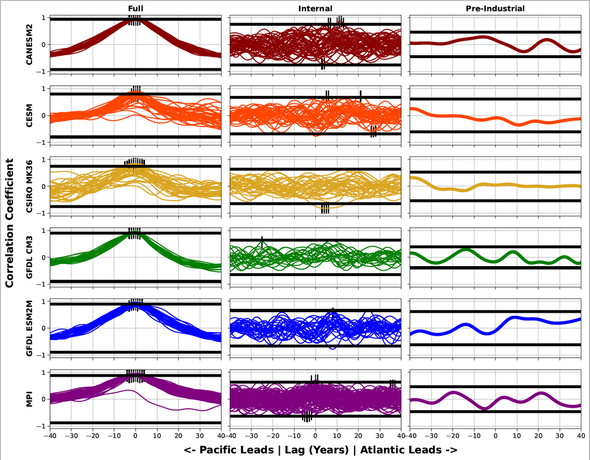
This paper looks at possible links between the North Atlantic and North Pacific oceans. Previous studies argued that a link does exist, although a satisfying dynamical explanation was never identified. We reanalyze the possible connection using modified statistics and a set of large ensembles from multiple models. Our findings suggest that no internal link exists; previous studies may have been confounded by similar global warming signals in each basin.
The figure below shows some of our results. Each row shows a single large ensemble (or one climate model). The left column shows the relationships when both internal variability and global warming are included. The middle column shows how it changes when the global warming signal is removed. Finally, the right column is a different model configuration that doesn't include global warming at all. The ticks indicate where the relationships are higher than 99% of 10000 randomly generated relationships. Essentially, the only way to consistently get a significant relationship is to include global warming.
A PDF is also available below.
This paper looks at possible links between the North Atlantic and North Pacific oceans. Previous studies argued that a link does exist, although a satisfying dynamical explanation was never identified. We reanalyze the possible connection using modified statistics and a set of large ensembles from multiple models. Our findings suggest that no internal link exists; previous studies may have been confounded by similar global warming signals in each basin.
The figure below shows some of our results. Each row shows a single large ensemble (or one climate model). The left column shows the relationships when both internal variability and global warming are included. The middle column shows how it changes when the global warming signal is removed. Finally, the right column is a different model configuration that doesn't include global warming at all. The ticks indicate where the relationships are higher than 99% of 10000 randomly generated relationships. Essentially, the only way to consistently get a significant relationship is to include global warming.
"Significance Tests in Climate Science" is a paper that has influenced much of my thinking on applying statistics in science. Skepticism is a necessary and useful part of creating knowledge, and this paper captures that essence pertaining to significance testing well. It can be found at this link: https://journals.ametsoc.org/view/journals/clim/23/22/2010jcli3746.1.xml?tab_body=pdf
